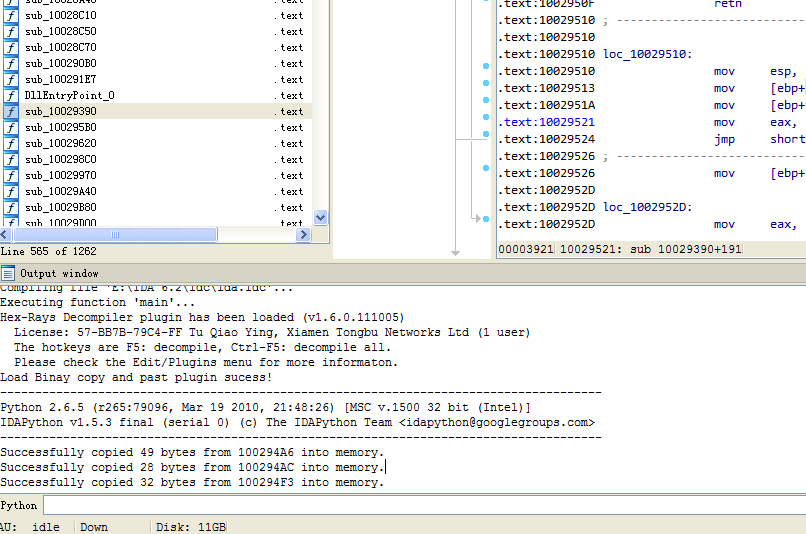
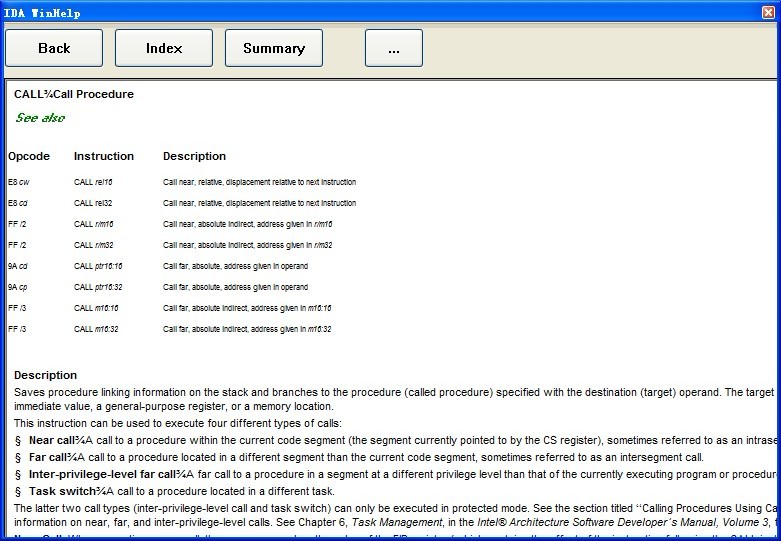
这个鸟插件好用倒是好用,但是不知道作者为什么会把快捷键做成F2,这个很蛋疼啊。想设置个断点都没法设置。于是果断的把代码改了一下,其实很简单。吧快捷键都按了一遍发现F3木有人用,于是就改成了F3.
QQ International 1.2(2124) Self Check Patch
Click here to download the file!Don’t know how to use the patch? click here. 
Still no Don’t display the Today window during the next 5 days. check box at the window bottom.
Interactive Delphi Reconstructor 2.5.3 Beta
IDR (Interactive Delphi Reconstructor) – a decompiler of executable files (EXE) and dynamic libraries (DLL), written in Delphi and executed in Windows32 environment.
The program firstly is intended for the companies, engaged by development of anti-virus software. It can also help programmers to recover lost source code of programs appreciably.
The current version of the program can process files (GUI and console applications), compiled by Delphi compilers of versions Delphi2 – Delphi2010.
Calling IDA APIs from IDAPython with ctypes
IDAPython 提供了一些列封装好的ida sdk函数,但是由于SWIG的限制或者一切其他的原因有一部分api并没有封装到这个库中。为了能够调用在idapython中没有封装的api函数get_loader_name(),但是又不想因为调用这么一个简单的函数而编写一个插件进行测试,那么此时就可以使用ctypes 来实现了。
所有IDA API都是由ida的核心动态库来提供的,在Windows系统下这个库为ida.wll(或者ida64.wll),在linux系统下为libida[64].so,在os x系统下为libida[64].dylib. ctypes提供了一个非常好的功能来创建一个封装的Dll到处函数类,可以把他们看成一个类实例的属性来调用。下面的代码用于获取不同系统下的ida实例:
import ctypes
import sys
idaname = "ida64" if __EA64__ else "ida"
if sys.platform == "win32":
dll = ctypes.windll[idaname + ".wll"]
elif sys.platform == "linux2":
dll = ctypes.cdll["lib" + idaname + ".so"]
elif sys.platform == "darwin":
dll = ctypes.cdll["lib" + idaname + ".dylib"]
我们使用windll是因为ida的api在windows系统下是使用stdcall调用约定的(可以通过查看pro.h中队用的idaapi的定义来确定调用类型)
现在我们只需要像调用一个dll对象的一个属性一样来调用我们的函数,但是首先我们要准备好我们函数需要的参数,下面是从loader.hpp中得到的函数的定义:
idaman ssize_t ida_export get_loader_name(char *buf, size_t bufsize);
ctypes提供了一个非常方便的函数来创建字符buffer:
buf = ctypes.create_string_buffer(256)
IDA Unicode String Anylist and comment maker
早在很久之前就写过一个导入Unicode字符串注释的脚本,但是脚本操作还是有自己的局限性。每次都要通过其他的分析工具搜索定位到字符串,然后导出,在然后倒入。这是多么蛋疼的时间事情啊。 😎

(关于插图:
Augusta Ada King, Countess of Lovelace (10 December 1815 – 27 November 1852), born Augusta Ada Byron, was an English writer chiefly known for her work on Charles Babbage’s early mechanical general-purpose computer, the analytical engine. Her notes on the engine include what is recognised as the first algorithm intended to be processed by a machine; thanks to this, she is sometimes considered the “World’s First Computer Programmer”
She was the only legitimate child of the poet Lord Byron (with Anne Isabella Milbanke). She had no relationship with her father, who died when she was nine. As a young adult, she took an interest in mathematics, and in particular Babbage’s work on the analytical engine. Between 1842 and 1843, she translated an article by Italian mathematician Luigi Menabrea on the engine, which she supplemented with a set of notes of her own. These notes contain what is considered the first computer programme — that is, an algorithm encoded for processing by a machine. Though Babbage’s engine has never been built, Lovelace’s notes are important in the early history of computers. She also foresaw the capability of computers to go beyond mere calculating or number-crunching while others, including Babbage himself, focused only on these capabilities.)
到网上随便搜了搜发现hexrays曾经发布过一个处理unicode字符串的插件,猛击此处访问插件页面。插件的名字叫做unispector。并且在插件页面提供了相关的源代码下载,但是偶下载编译之后在新版的ida下无法成功加载,并且没有出现应有的效果。
IDA Binary Copy & Paste

Seeing there isn’t any binary copy-and-paste functionality in IDA, this plug-in will take care of both
copy and paste operations allowing you to take a chunk of binary from one place and overwrite
another with it. You need to modify your plugins.cfg file as this is a multi-function plug-in, needing
one invocation for copy and another for paste. Obviously it only supports copying and pasting
within IDA, however it could probably be extended to go beyond that.


